Skip to content

Alectrona

Commercial guide

How is commercial solar ROI and payback actually calculated?

Payback and return on a commercial array come down to three things: the capital cost, the annual saving it produces, and the first-year tax relief the spend can attract. This guide sets out how those fit together.

  • Commercial scale, over 50 kWp
  • On-site 3D drone survey + PV*SOL
  • Engineer-led, outside MCS
Reviews

The feedback we work to earn

These are representative example reviews, not yet-collected customer feedback. They are written to illustrate the kind of feedback Alectrona aims to earn and are shown as design placeholders while we gather and verify reviews from our first commercial clients. Alectrona is the commercial solar trading brand of RVTC LTD.

What set Alectrona apart was the documented design pack. We had quotes from three installers, but only Alectrona handed us a full set of drawings, a single-line diagram and a design referencing BS 7671 and the G99 connection process. The whole thing read like an engineering submission rather than a sales brochure. Our M&E consultant reviewed it and signed it off without a single query. That gave the board the confidence to release the capital.

Estates Manager, academy trust (Yorkshire)

Other firms priced our roof off a satellite image and a desktop guess. Alectrona flew an in-house drone survey, fully insured and flown by a qualified commercial drone pilot, and built a 3D model of the actual roof. It picked up plant, vents and a parapet line that a flat aerial photo had completely missed, which changed the panel layout. I would rather find that out at design stage than on the day the scaffold goes up. The accuracy of that survey is the reason I trusted everything that followed.

Facilities Manager, distribution centre (East Midlands)

As a finance director I was wary of being oversold a system bigger than we could use. Alectrona modelled the array against our actual half-hourly consumption data rather than an annual total, so it is sized to what we genuinely draw on site during the day. They were honest that exporting surplus is worth far less than self-consumption, and built the design around that. The capital case stacked up because the engineering was honest, not because the numbers were inflated.

Finance Director, logistics group (North West)

We were undecided between buying outright, leasing and a PPA. Alectrona laid out all three side by side with the pros and cons of each against our balance sheet, instead of pushing the one that pays them best. They were clear about where a PPA makes sense and where capex wins, and pointed us at our own accountant for the tax treatment. The survey and design took a little longer than I expected, but the thoroughness was worth the wait. Genuinely consultative.

Property Director, retail park (West Midlands)

The install crew were tidy and well run, and worked to a clear CDM 2015 plan with a proper site induction and RAMS. What impressed me most was the handover. We received a full commissioning pack with the IEC 62446-1 test results, certification, O&M documentation and an as-built record for our maintenance team. As the people who have to live with this asset for the next twenty years, having that paperwork in order matters enormously. Nothing was left loose.

Operations Director, food manufacturer (Lincolnshire)

I expected the usual hard sell and got the opposite. After surveying our site Alectrona told us one roof section was not worth covering because of shading, and that a smaller, well-sited array was the better investment than filling every square metre. There was no commission-driven upselling and no pressure. For a six-figure capital project, that straight talk is exactly what you want from the people advising you. We will be using them again on our second site.

Managing Director, engineering firm (Sheffield)

  • Applies to Commercial systems over 50 kWp, outside MCS
  • Payback Set by net capital cost against annual saving; modelled per site
  • Return Bill reduction as a yield over the system's working life
  • Bill reduction Driven by how much generation the building self-consumes
  • Biggest lever Self-consumption, modelled from your half-hourly load
01 The short version

ROI and payback

OrientationThis is plain-English orientation for a finance or facilities director, not formal financial or tax advice. The figures depend on your site; we confirm the specifics from the survey and PV*SOL model, and your accountant confirms the tax position.

For a system over 50 kWp, the financial case is built bottom-up rather than pulled from a brochure. You start with the installed capital cost, work out how much electricity the array offsets each year, value that saving against your real tariffs, then apply any first-year tax relief on the capital spend. Payback is the point where cumulative saving has covered the net cost. Return is that saving expressed as a yield over the system's working life.

None of those inputs is a fixed number we can quote cold. They depend on your roof, your load shape and the tariffs you actually pay, which is why the cost side is survey-led and there is no honest headline price. What this page does is explain the mechanics, so you can read any payback or ROI figure, including ours, and know what assumptions sit behind it. It is a guide, not formal financial or tax advice; we confirm the specifics for your site.

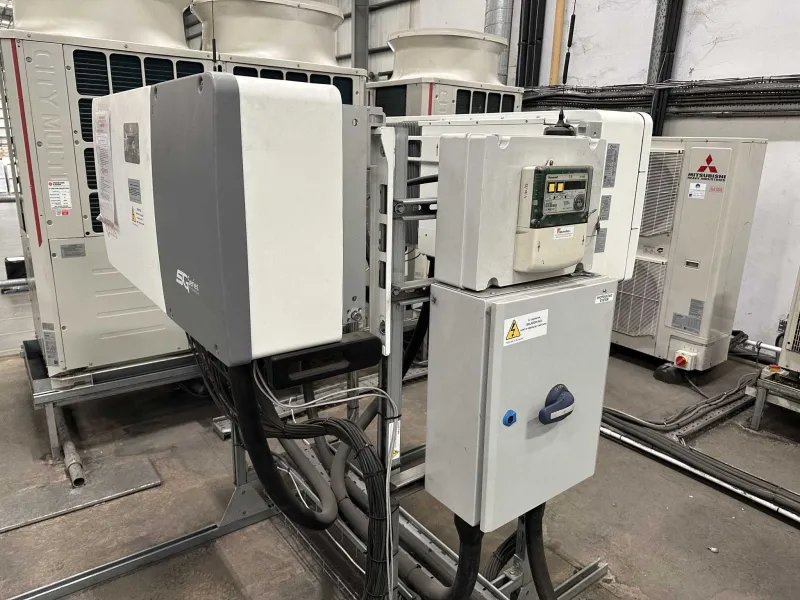
Commercial rooftop solar, the subject of this guide: ROI and payback
Engineer-led commercial solar over 50 kWp, sized to your load.
02

Capex against annual saving

The first half of the calculation is the capital cost. For a commercial array this is the installed price of the system: panels, inverters, mounting, cabling, the grid-connection works and commissioning. It is a one-off capital outlay, paid outright or financed, and it is the figure every return is measured against. Because it is set by your specific roof, array size and connection, it comes from the on-site survey rather than a price list.

The second half is the annual saving the array produces. That has two parts. The larger part is avoided import: every unit the building uses straight from the roof is a unit you do not buy from your supplier at the import rate. The smaller part is export: units the array generates but the building does not use at that moment, sold to the grid. Export is paid at a much lower rate than import, so the design works to keep as much generation as possible on site. Add avoided import to export income and you have the gross annual saving the system is worked against.

03

Why self-consumption drives the return

The single biggest lever on payback is self-consumption: the share of generation the building uses itself rather than exporting. A unit you self-consume offsets an expensive import unit. The same unit exported earns a fraction of that. So two identical arrays on identical roofs can return very differently, purely because one site uses its generation through the day and the other spills it to the grid.

This is why the array is sized to your load rather than to your roof area. We take your half-hourly consumption data and model it against generation in PV*SOL for your exact roof, which gives an honest split of what is self-consumed and what is exported before anything is specified. A site with steady weekday daytime demand, or round-the-clock load, self-consumes a high share and pays back faster. A site that is busy only in short bursts exports more, and we say so plainly rather than oversizing a roof that would export cheaply.

04

AIA and first-year tax relief

The capital cost is not the only number that moves payback. Commercial solar is plant and machinery for tax purposes, so the spend can attract first-year capital allowances such as the Annual Investment Allowance (AIA). Where it applies, that relief lets a qualifying business set the cost against taxable profit in year one rather than over many years, which cuts the effective net cost of the system and pulls the payback point forward.

The amount of relief, and whether it applies to your business at all, depends on your tax position and the allowances in force at the time you invest. This is general orientation, indicative and not financial or tax advice; we are not tax advisers. The figures we publish that include a year-one allowance say so explicitly in their assumptions, and you should confirm the position with a qualified accountant or tax adviser against your own circumstances before you rely on it.

05

Reading a payback and ROI figure

Put the pieces together and you get a payback period and a return. Payback is the point where the cumulative annual saving has covered the net capital cost, so the faster a site self-consumes its generation and the more first-year relief the spend attracts, the sooner that point arrives. Expressed as a return over the system's working life, the same saving becomes a yield: the bill reduction the array delivers, set against the net cost, run out over the years the system keeps working.

Any payback or ROI figure, including any we show you, rests on a particular set of inputs: system size, installed cost, your import and export tariffs, the self-consumption share, and the tax treatment of the spend. Move any one of those and the result moves with it, which is why we will not headline a number cold. They are indicative and general information, not financial or tax advice: confirm the position with a qualified accountant or tax adviser. Your real numbers come from the survey, the PV*SOL model of your roof and load, and your own tax position.

06

Should a finance director look at payback, or at NPV and IRR?

Payback answers one question: how long until the saving has repaid the spend. It is a useful early screen, but on its own it tells a finance director nothing about what the asset is worth across its full working life, which on a commercial array runs well beyond the payback point. Two systems with the same payback can hold very different value if one keeps saving for years longer than the other. That is why a serious appraisal pairs simple payback with a return that values the whole life of the asset.

The two measures that do that are net present value (NPV) and the internal rate of return (IRR). NPV discounts every future year of saving back to today and nets off the capital cost, so a positive NPV means the array is worth more than it costs in present-value terms. IRR expresses the same cash flows as a single percentage you can set against your cost of capital or hurdle rate. Discounting matters because a pound saved in year ten is worth less than a pound saved now, and a payback figure ignores that entirely. HM Treasury's Green Book sets out the discounting logic public bodies use to appraise this kind of long-lived investment, and the same principle applies to a private capital decision. We can model the cash flows so your accountant or finance team can run them against your own discount rate. This is orientation, not financial advice; your hurdle rate and tax position are yours to confirm. The figures themselves stay survey-led, drawn from the same PV*SOL model behind our commercial solar cost guide, and the capital-allowance treatment is covered under capital allowances.

07

What ongoing costs belong in a whole-life ROI model?

A whole-life return is more than generation minus tariff. An honest model also carries the running costs that sit against the saving over twenty-five years or more, because leaving them out flatters the payback. The largest single one is usually the inverter: string and central inverters carry shorter design lives than the panels, so a long-horizon model should provision for at least one inverter replacement within the system life rather than pretend the array runs maintenance-free. Alongside that sit planned operation and maintenance, periodic electrical inspection and any uplift to your buildings and plant insurance once the array is on the roof.

These are not large numbers against the saving, but they are real, and they belong in the cash flow rather than the small print. Periodic inspection and testing of the installation follows the verification regime in BS EN 62446 and the wider wiring standard BS 7671, so the inspection cost is a known, scheduled item rather than a surprise. We set out what ongoing servicing involves in the delivery process, and the panel and inverter warranty terms that offset some of this risk come from the specified product datasheets, not an assumption. Netting these costs against the gross saving gives the figure a finance director should actually appraise, and it is why our models show the saving after operating costs, not the headline generation value.

08

How do tariff assumptions over the system life affect the return?

Every payback and return figure rests on an assumed price for the electricity the array displaces, and over a twenty-five-year horizon the path of that import price is the single largest external uncertainty in the model. A flat tariff assumption is the cautious case; if your import price rises over the life of the system, each self-consumed unit is worth more and the return improves, which is why we hold the tariff assumption conservative rather than bake in optimistic escalation. Ofgem publishes the regulatory backdrop to non-domestic electricity pricing, and your own contracted rates and renewal position are the firmest inputs of all, so we model against your actual tariffs rather than a market average.

The export side moves too. Units the array generates but the building cannot use are sold under a Smart Export Guarantee arrangement or a negotiated export contract, paid well below the import rate, which is why the design keeps generation on site wherever the load allows. We cover that mechanism in the export and SEG guide. Where the daytime load cannot absorb the generation, shifting surplus into an evening or overnight load with battery storage changes the self-consumption assumption and therefore the return, which we model on your real numbers before recommending it. Because the result is this sensitive to a handful of assumptions, we present a banded outcome against your half-hourly data rather than a single headline, and every figure states the tariff path it rests on. Indicative orientation, not financial or tax advice; confirm the position with a qualified accountant or tax adviser.

09 How we quote

Past the guide, this is how your figure actually gets set.

  1. Survey

    On-site 3D drone survey

    Our own insured pilot flies your roof and captures the real geometry and shading, so the design starts from your building instead of a satellite guess.

    Booked to suit your operating hours

  2. Model

    PV*SOL design and proposal

    We model the array in bankable-grade software, size it around your daytime load, and set out generation, savings and payback across three funding routes.

    Modelled, not promised

  3. Install

    Engineered and installed

    Designed and installed to BS 7671, commissioned to IEC 62446-1, connected under G99 and run under CDM 2015. Alectrona is typically the Principal Contractor.

    Outside MCS, assured by the non-MCS stack

  4. Aftercare

    Operations and maintenance

    A 12-month defects period backed by an Insurance-Backed Guarantee, then ongoing operations and maintenance so the asset keeps earning for its full working life.

    Kept performing, year on year

Indicative, not financial or tax advice. Confirm the position with a qualified accountant or tax adviser. Your figure comes from a survey-led PV*SOL model.

10 FAQ

ROI and payback: common questions

Payback depends on three inputs we cannot know without a survey: your installed capital cost, the annual saving the array produces, and your tax position. The cost is set by your roof, array size and grid connection. The saving turns on how much generation your building self-consumes, which we model from your half-hourly load. We can walk you through the mechanics as orientation, but a real figure comes from the modelled numbers for your site.

Self-consumption. A unit the building uses straight from the roof offsets an expensive import unit, while a unit exported is paid far less. A site with steady daytime or round-the-clock demand uses a high share of its generation and pays back faster. A site that exports more pays back slower. The roof area matters far less than how well the load lines up with generation through the day.

Commercial solar counts as plant and machinery, so the capital spend can attract first-year capital allowances such as the Annual Investment Allowance, where your business qualifies. That relief reduces the effective net cost in year one and brings the payback point forward. The amount depends on your tax position and the allowances in force when you invest. This is indicative, not financial or tax advice, so confirm the position with a qualified accountant or tax adviser before relying on it.

No. Any figure we discuss is shown for orientation, not a quote or a guarantee, and it is indicative general information, not financial or tax advice. Each rests on stated assumptions about system size, cost, tariff, self-consumption share and tax treatment. Your actual return comes from the survey, the PV*SOL model and your own tax position.

No, and it should not be. MCS is the domestic scheme that does not apply here, so a commercial array over 50 kWp sits outside it by design. Assurance comes from the engineering and compliance stack instead: an on-site drone survey, a PV*SOL load model, CDM 2015 with an appointed principal designer and principal contractor, recognised wiring and commissioning standards, and a G99 grid connection.

A payback figure is only as firm as the inputs behind it, so a small change in the import tariff, the self-consumption share or the capital cost moves the result. That is why we model your half-hourly load against generation in PV*SOL rather than headline a number, and why every figure we show states the assumptions it rests on. Change an assumption and the payback moves with it.

Output falls gradually over the working life rather than stopping, so a payback or return modelled over many years has to account for it. Modules lose a small share of output each year, which the PV*SOL model reflects when it works generation across the system life. We take the degradation profile from the specified module datasheet rather than assuming one, so the return reflects the panels actually proposed for your roof.

No. The feasibility read that produces an indicative payback comes before any quote, and the first pass is free. We model your half-hourly load against generation in PV*SOL and set the saving against an indicative installed cost, so you see the mechanics before you commit. A fully bankable model is part of the survey-led commercial solar cost work, not a separate charge.

An indicative read follows shortly after we have your half-hourly consumption data and the roof survey, because both feed the PV*SOL model directly. A firmer, bankable figure comes once the array is sized and an installed cost is agreed, since payback turns on that net capital number. The tax treatment that affects year one is then confirmed by your accountant against the allowances current at the time you invest.

Get a commercial quote

Get the numbers for your roof.

A guide can only take you so far. The figure you get is modelled from your own half-hourly load and a system sized from the on-site drone survey. No obligation, and systems this size sit outside the domestic MCS scheme, so the assurance is the engineering stack.

  • On-site 3D drone survey, fully insured in-house pilot
  • Half-hourly load modelled in PV*SOL before anything is specified
  • Engineer-led, assured to the non-MCS standard (CDM 2015)
  • Capex, lease-purchase or PPA, whichever suits you