Skip to content

Alectrona

Commercial guide

What is half-hourly metering, and why it matters for solar?

Half-hourly metering records your site's electricity use in 30-minute blocks across the day, and that data is the single best input for sizing a commercial solar system to your real load.

  • Commercial scale, over 50 kWp
  • On-site 3D drone survey + PV*SOL
  • Engineer-led, outside MCS
Reviews

The feedback we work to earn

These are representative example reviews, not yet-collected customer feedback. They are written to illustrate the kind of feedback Alectrona aims to earn and are shown as design placeholders while we gather and verify reviews from our first commercial clients. Alectrona is the commercial solar trading brand of RVTC LTD.

What set Alectrona apart was the documented design pack. We had quotes from three installers, but only Alectrona handed us a full set of drawings, a single-line diagram and a design referencing BS 7671 and the G99 connection process. The whole thing read like an engineering submission rather than a sales brochure. Our M&E consultant reviewed it and signed it off without a single query. That gave the board the confidence to release the capital.

Estates Manager, academy trust (Yorkshire)

Other firms priced our roof off a satellite image and a desktop guess. Alectrona flew an in-house drone survey, fully insured and flown by a qualified commercial drone pilot, and built a 3D model of the actual roof. It picked up plant, vents and a parapet line that a flat aerial photo had completely missed, which changed the panel layout. I would rather find that out at design stage than on the day the scaffold goes up. The accuracy of that survey is the reason I trusted everything that followed.

Facilities Manager, distribution centre (East Midlands)

As a finance director I was wary of being oversold a system bigger than we could use. Alectrona modelled the array against our actual half-hourly consumption data rather than an annual total, so it is sized to what we genuinely draw on site during the day. They were honest that exporting surplus is worth far less than self-consumption, and built the design around that. The capital case stacked up because the engineering was honest, not because the numbers were inflated.

Finance Director, logistics group (North West)

We were undecided between buying outright, leasing and a PPA. Alectrona laid out all three side by side with the pros and cons of each against our balance sheet, instead of pushing the one that pays them best. They were clear about where a PPA makes sense and where capex wins, and pointed us at our own accountant for the tax treatment. The survey and design took a little longer than I expected, but the thoroughness was worth the wait. Genuinely consultative.

Property Director, retail park (West Midlands)

The install crew were tidy and well run, and worked to a clear CDM 2015 plan with a proper site induction and RAMS. What impressed me most was the handover. We received a full commissioning pack with the IEC 62446-1 test results, certification, O&M documentation and an as-built record for our maintenance team. As the people who have to live with this asset for the next twenty years, having that paperwork in order matters enormously. Nothing was left loose.

Operations Director, food manufacturer (Lincolnshire)

I expected the usual hard sell and got the opposite. After surveying our site Alectrona told us one roof section was not worth covering because of shading, and that a smaller, well-sited array was the better investment than filling every square metre. There was no commission-driven upselling and no pressure. For a six-figure capital project, that straight talk is exactly what you want from the people advising you. We will be using them again on our second site.

Managing Director, engineering firm (Sheffield)

  • What it is Electricity use settled in 30-minute blocks, 48 readings a day
  • Applies to Most larger commercial supplies, very likely your >50 kWp site
  • Why it matters Reveals when you use power, not only the annual total
  • Best for sizing Shows the daytime load curve solar must match
  • Data we ask for At least 12 months of HH consumption, exported as CSV
01 The short version

Half-hourly metering

OrientationThis is a plain-English guide to help you orient before a project, not formal advice. Half-hourly settlement rules and the data your supplier holds vary by site, so we confirm the specifics for your meter before any modelling.

Half-hourly (HH) metering means your supply is settled in 48 readings a day, one for every 30-minute period, rather than a single monthly total. Most larger commercial sites already run on it, often without the finance or facilities team thinking about it, because it is how the electricity market settles supplies above a certain demand threshold.

For a solar project that data is invaluable. A monthly bill tells us how much you used; HH data tells us when. Since a solar array pays its best when its output is consumed on site as it is produced, knowing the shape of your daytime load is what lets us size a system to match it rather than guess at it.

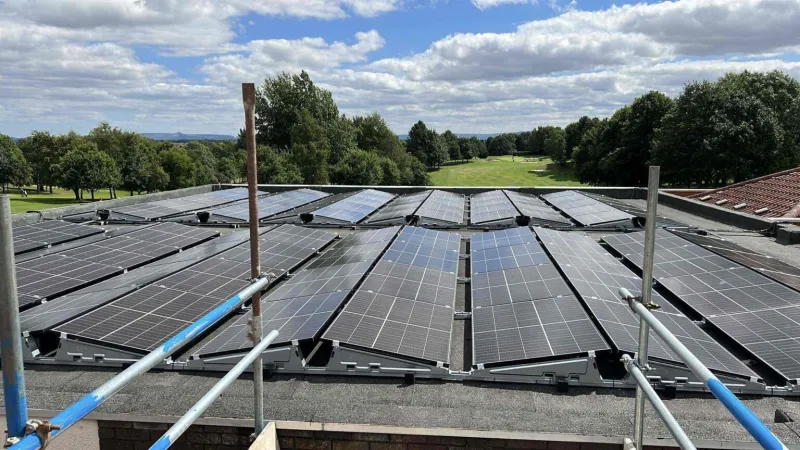
Commercial rooftop solar, the subject of this guide: Half-hourly metering
An on-site drone survey and a PV*SOL model behind every quote.
02

What half-hourly metering actually is

A half-hourly meter, sometimes installed with a separate communications device that reports the readings automatically, records your import in 30-minute blocks and sends those readings to your supplier each day. The result is 48 data points per day, around 17,520 over a year, that together draw a detailed picture of how your site draws power around the clock.

It contrasts with non-half-hourly supplies, which are settled on estimated profiles and periodic readings. HH settlement was historically tied to your maximum demand and the profile class of your meter; the rules have been changing under the industry move to market-wide half-hourly settlement, but the practical point for a commercial buyer is simple. If your site is large enough to be considering solar over 50 kWp, it is very likely already metered half-hourly.

03

Why HH data is the best input for sizing solar

Solar generation follows a predictable daily curve: nothing overnight, rising through the morning, a midday peak, falling away into the evening. Your building has its own demand curve. The value of an array depends almost entirely on how well those two curves overlap, because a unit generated and used on site offsets an expensive imported unit, while a unit exported earns far less.

HH consumption data lets us plot your real demand curve against modelled generation, half-hour by half-hour, across the seasons. That tells us how much of the array's output you would actually consume rather than export, which is the number that drives the whole business case. A monthly total simply cannot show this. Two sites with identical annual consumption can have completely different solar cases depending on whether the load sits in the daytime or after dark.

  • A flat, daytime-heavy load (steady machinery, refrigeration, process plant) tends to self-consume a high share of generation.
  • A peaky or evening-weighted load self-consumes less, and may point toward a smaller array, or storage to shift surplus into the demand.
What your load shape decides
Daytime-heavy load

Flat, steady daytime demand

Where the load runs through the middle of the day, it sits squarely under the generation curve, so a high share of the array's output is consumed on site rather than exported.

  • Steady machinery, refrigeration or process plant
  • Demand lands under the midday generation peak
  • Tends to self-consume a high share of generation
  • Each self-consumed unit offsets an expensive imported unit
Evening-weighted load

Peaky or after-dark demand

Where the load is peaky or weighted into the evening, less of the generation is used as it is produced, which can point toward a smaller array or storage to shift surplus into the demand.

  • Demand falls outside the daytime generation curve
  • Self-consumes less of an identical system
  • May point toward a smaller array
  • Or storage to shift surplus into the demand
04

How Alectrona uses your half-hourly data

When we model a site, we ask for at least a year of HH consumption data, which your supplier or third-party intermediary can usually export as a CSV. A full year matters because it captures the seasonal swing: winter generation is a fraction of summer, and your own load may rise or fall across the year.

We line that data up against generation modelled for your exact roof, using the geometry from our in-house drone survey rather than a desktop estimate. The output is an honest split of what would be self-consumed versus exported, before any system is specified. That self-consumption figure is what we size around, so the array fits your demand instead of just filling the roof. Where the daytime match is weaker, we model whether storage earns its place rather than overbuilding an array that would export cheaply.

05

How to get your half-hourly data

If you are not sure whether your site is on HH metering, your electricity bill usually says so, or your supplier can confirm it in a phone call. The data itself is held by your supplier and, for HH supplies, by a data collector appointed under your contract.

You can request a HH data export directly, typically covering the last 12 months as a spreadsheet. Whether a charge or any conditions apply varies, so check with your supplier when you ask. If you would rather we handle it, we can guide the request, or work from a recent export you already hold. Either way, the modelling does not start from a sales assumption; it starts from your meter.

06

Who runs half-hourly settlement, and is it changing?

Half-hourly data is not only held on your meter; it also feeds a national settlement process that decides how much each supplier buys and pays for. That process runs under the Balancing and Settlement Code, administered by Elexon, the body appointed to manage electricity settlement in Great Britain. Your half-hourly readings are collected, aggregated and reconciled through that framework, which is why the data your supplier can export to you is the same data the market settles on. For a buyer modelling solar, that is reassuring: the consumption curve is metered and auditable rather than estimated.

The framework is in the middle of a significant change. Under the Market-wide Half-Hourly Settlement (MHHS) programme, overseen by the energy regulator Ofgem and delivered through Elexon, settlement is moving so that far more supplies are settled on actual half-hourly data rather than estimated profiles. The programme is being rolled out in phases rather than overnight, so the precise rules and timetable that apply to your meter are worth confirming rather than assuming. The practical takeaway for a commercial buyer is unchanged: a site large enough to be weighing solar over 50 kWp is very likely already settled half-hourly today, and the direction of travel only makes granular data more central. We treat the settlement position as orientation and confirm the current position for your meter point before it drives any modelling, in line with our network charges guide.

07

How does half-hourly data expose the time-of-day value solar can capture?

Half-hourly data shows when you use power, and it shows when that power is most expensive, which is where solar earns disproportionately. Distribution charges, the DUoS element of your bill set by your network operator, are banded by time of day into red, amber and green periods, with the red band covering the highest-cost peak hours on weekday afternoons and early evenings. Because those bands are defined per half-hour, only half-hourly data lets us see how much of your consumption lands in the expensive red and amber windows. For sites in our region the charging statement is published by Northern Powergrid, the distribution operator for Yorkshire and northern and north-east Lincolnshire.

Solar generation peaks around the middle of the day, which overlaps the amber band and the leading edge of the afternoon red period for much of the year. Where your half-hourly profile shows heavy daytime demand running into those bands, each self-consumed unit avoids the wholesale energy cost and the higher distribution charge attached to that half-hour as well, which strengthens the case beyond a flat-rate calculation. Where the profile is flatter or evening-weighted, the data shows that too, and points toward whether shifting surplus with battery storage moves generation into a more valuable window. We work this through against your actual banded charges rather than an averaged tariff, and any payback or return figure that follows stays modelled rather than promised, with the basis stated and the detail held in the commercial finance section. The headline cost framing for a project of this kind is surveyed in our commercial solar cost guide.

08

What format does half-hourly data come in, and what can go wrong with it?

When you request an export, half-hourly data usually arrives as a CSV keyed to your meter point, identified by its MPAN, the supply number printed on your bill. Each row carries a date and the 48 half-hourly import values for that day, and a clean twelve-month file is the input our design model wants. Knowing the shape of the file in advance makes the request to your supplier or data collector quicker, because you can ask for the right thing rather than a summary report that strips out the half-hourly detail.

Real exports are rarely perfect, and the gaps matter for honest modelling. Clock changes in spring and autumn produce short and long days in the data and need handling so a missing or doubled period does not distort a season. Communications outages can leave estimated rather than actual readings for some half-hours, which the settlement process later reconciles but a raw export may still show. A change of supplier or meter within the year can split the record across two files. We clean and stitch these before modelling rather than feeding a flawed file straight into the design, because the whole point of using metered data is that the self-consumption split is grounded rather than assumed. This sits alongside the roof side of the model covered in how much roof space, and the two together decide whether a site clears the bar set out in is commercial solar worth it.

09

Who actually holds your half-hourly data, and how is access granted?

Your readings pass through a chain of appointed agents before they reach you or us. A half-hourly supply is not served by the supplier alone. Under the Balancing and Settlement Code administered by Elexon, separate parties are appointed against your meter point: a Meter Operator responsible for the metering equipment, and the data services that collect and aggregate the half-hourly readings for settlement. These appointments are recorded against your MPAN, the supply number on your bill, and they are the parties who actually hold the granular interval record rather than a summarised monthly figure.

Access is granted by authorisation from the account holder rather than by owning the meter. Because the data belongs to your supply contract, the usual route is a Letter of Authority: a short signed instruction from the account holder permitting your supplier, or the appointed data service, to release the half-hourly export to a named third party. With that in place the twelve-month file can be sent to us directly, which removes the step of you forwarding it on, and any release condition the agent attaches is dealt with at the same time.

The practical point for a buyer is that arranging access early, alongside the connection thinking in our DNO explained guide, keeps the design moving. We treat the agent appointments and any release conditions as orientation and confirm the current position for your meter point before it drives modelling, in the same way the wider network charges framework is confirmed rather than assumed.

10 How we quote

Past the guide, this is how your figure actually gets set.

  1. Survey

    On-site 3D drone survey

    Our own insured pilot flies your roof and captures the real geometry and shading, so the design starts from your building instead of a satellite guess.

    Booked to suit your operating hours

  2. Model

    PV*SOL design and proposal

    We model the array in bankable-grade software, size it around your daytime load, and set out generation, savings and payback across three funding routes.

    Modelled, not promised

  3. Install

    Engineered and installed

    Designed and installed to BS 7671, commissioned to IEC 62446-1, connected under G99 and run under CDM 2015. Alectrona is typically the Principal Contractor.

    Outside MCS, assured by the non-MCS stack

  4. Aftercare

    Operations and maintenance

    A 12-month defects period backed by an Insurance-Backed Guarantee, then ongoing operations and maintenance so the asset keeps earning for its full working life.

    Kept performing, year on year

11 FAQ

Half-hourly metering: common questions

Your electricity bill usually indicates it, or your supplier can confirm in a short call. As a rule of thumb, sites large enough to be considering commercial solar over 50 kWp are very likely already settled half-hourly, because HH settlement applies to supplies above a certain demand level.

An annual or monthly total tells us how much electricity you use, but not when. Solar earns its best when generation is consumed on site as it is produced, so the value depends on how your demand lines up with the daily generation curve. Two sites with the same annual consumption can have very different solar cases depending on whether the load is daytime or after dark. Half-hourly data is what lets us tell the difference and size accordingly.

We ask for at least 12 months, so the model captures the full seasonal swing in both generation and your own load. Your supplier, or the data collector appointed under your HH contract, can usually export it as a CSV on request.

If you would prefer not to chase it, we can guide the request or work from a recent export you already hold.

Self-consumption is the share of what your array generates that your building uses on the spot, rather than exporting to the grid. It matters because a self-consumed unit offsets an expensive imported unit, while an exported unit earns far less. Sizing the system to maximise sensible self-consumption is the core of getting the economics right, and your half-hourly data is what makes that figure honest rather than assumed.

Request it at the start, before any design work, because the metered profile is what the system is sized around rather than something checked at the end. A twelve-month export from your supplier or appointed data collector typically arrives within a few working days of asking, though timescales vary by supplier and occasionally a charge or condition applies, so confirm when you request it. Getting it early avoids a redesign later, and if you would rather not chase it we can guide the request or work from a recent export you already hold.

The data itself is not the cost driver, and the system price is survey-led rather than set by the metering step. Some suppliers or data collectors apply a small charge or a condition for a twelve-month export, which they confirm when you ask, but that sits apart from the capital figure. The installed cost of a commercial system over 50 kWp comes from the in-house drone survey, the structural and access position and the grid connection, modelled in PV*SOL against this half-hourly data, which the commercial solar cost guide explains in full.

Get a commercial quote

Get the numbers for your roof.

A guide can only take you so far. The figure you get is modelled from your own half-hourly load and a system sized from the on-site drone survey. No obligation, and systems this size sit outside the domestic MCS scheme, so the assurance is the engineering stack.

  • On-site 3D drone survey, fully insured in-house pilot
  • Half-hourly load modelled in PV*SOL before anything is specified
  • Engineer-led, assured to the non-MCS standard (CDM 2015)
  • Capex, lease-purchase or PPA, whichever suits you