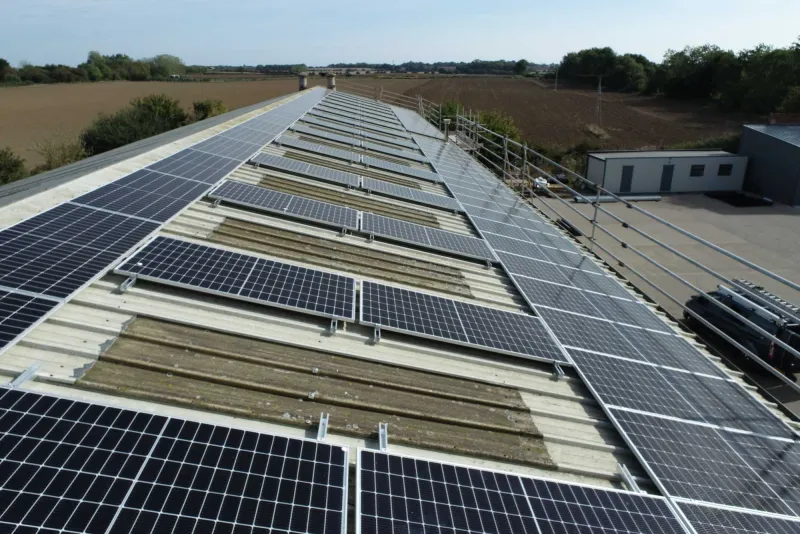
What set Alectrona apart was the documented design pack. We had quotes from three installers, but only Alectrona handed us a full set of drawings, a single-line diagram and a design referencing BS 7671 and the G99 connection process. The whole thing read like an engineering submission rather than a sales brochure. Our M&E consultant reviewed it and signed it off without a single query. That gave the board the confidence to release the capital.
Alectrona
Commercial guideHow carbon savings from commercial solar are actually calculated
A carbon saving is a calculation. It is the electricity your array generates, in kWh, multiplied by the carbon factor of the grid it displaces, and the honest version shows the working rather than a round figure.
- Commercial scale, over 50 kWp
- On-site 3D drone survey + PV*SOL
- Engineer-led, outside MCS
The feedback we work to earn
These are representative example reviews, not yet-collected customer feedback. They are written to illustrate the kind of feedback Alectrona aims to earn and are shown as design placeholders while we gather and verify reviews from our first commercial clients. Alectrona is the commercial solar trading brand of RVTC LTD.
Other firms priced our roof off a satellite image and a desktop guess. Alectrona flew an in-house drone survey, fully insured and flown by a qualified commercial drone pilot, and built a 3D model of the actual roof. It picked up plant, vents and a parapet line that a flat aerial photo had completely missed, which changed the panel layout. I would rather find that out at design stage than on the day the scaffold goes up. The accuracy of that survey is the reason I trusted everything that followed.
As a finance director I was wary of being oversold a system bigger than we could use. Alectrona modelled the array against our actual half-hourly consumption data rather than an annual total, so it is sized to what we genuinely draw on site during the day. They were honest that exporting surplus is worth far less than self-consumption, and built the design around that. The capital case stacked up because the engineering was honest, not because the numbers were inflated.
We were undecided between buying outright, leasing and a PPA. Alectrona laid out all three side by side with the pros and cons of each against our balance sheet, instead of pushing the one that pays them best. They were clear about where a PPA makes sense and where capex wins, and pointed us at our own accountant for the tax treatment. The survey and design took a little longer than I expected, but the thoroughness was worth the wait. Genuinely consultative.
The install crew were tidy and well run, and worked to a clear CDM 2015 plan with a proper site induction and RAMS. What impressed me most was the handover. We received a full commissioning pack with the IEC 62446-1 test results, certification, O&M documentation and an as-built record for our maintenance team. As the people who have to live with this asset for the next twenty years, having that paperwork in order matters enormously. Nothing was left loose.
I expected the usual hard sell and got the opposite. After surveying our site Alectrona told us one roof section was not worth covering because of shading, and that a smaller, well-sited array was the better investment than filling every square metre. There was no commission-driven upselling and no pressure. For a six-figure capital project, that straight talk is exactly what you want from the people advising you. We will be using them again on our second site.
- The method Generation in kWh times the grid carbon factor in gCO2e/kWh
- Factor source The official UK government (DESNZ) greenhouse-gas conversion factors
- Reporting basis Scope 2 under the GHG Protocol, location-based and market-based
- Honest caveat The grid factor falls each year, so the per-kWh saving declines over time
- Our figure comes from Your modelled generation, never an invented tonnage
Carbon savings methodology
Ask three suppliers what carbon a solar array will save and you can get three confident tonnage figures, none of which shows its working. That is the wrong way round. A carbon saving is the output of a calculation, and a finance or sustainability lead who has to stand behind the number in a report needs the method behind it.
The method is simple to state. The carbon you avoid is the electricity your system generates, measured in kWh, multiplied by the carbon intensity of the grid electricity it displaces, expressed in grams of CO2 equivalent per kWh. The official UK government (formerly BEIS, now DESNZ) greenhouse-gas conversion factors give the grid figure, and the Greenhouse Gas (GHG) Protocol sets how it sits in your Scope 2 reporting. The two honest caveats are that the kWh comes from a model of your specific roof rather than a generic uplift, and that the grid factor falls year on year as the grid decarbonises, so the per-kWh saving declines over the asset's life.
Generation times the grid carbon factor
The core sum has two inputs. The first is generation, the kWh your array produces over a year, which our model returns for your exact roof. The second is the grid carbon factor, the grams of CO2 equivalent emitted per kWh of grid electricity, published in the UK government conversion factors and updated each year. Multiply the two and you have the carbon avoided.
It helps to split the generation in two, because the two halves displace different things. The kWh you self-consume on site directly replaces grid electricity you would otherwise have imported, so it is valued at the grid factor. The kWh you export displaces grid generation elsewhere; how that is treated depends on the reporting framework and the boundary you draw. The point for a buyer is that the figure is built from your modelled kWh and a published factor, line by line, rather than asserted as a single tonnage.
Location-based versus market-based
For most organisations, grid electricity sits in Scope 2 of the GHG Protocol, the indirect emissions from energy you buy. The Protocol asks you to report Scope 2 two ways, and solar interacts with each differently, so it is worth understanding which is which before a number lands in a report.
The location-based method values your grid electricity at the average carbon intensity of the grid you sit on, using the published conversion factor. On this basis, every kWh your array lets you avoid importing reduces your reported emissions at that grid factor. The market-based method reflects the specific electricity products you have contracted, such as a green tariff backed by certificates, and can already show a low or zero factor for purchased power, which changes how an on-site array reads against it. Neither method is wrong; they answer different questions, and a credible report is clear about which one a saving is stated under.
The GHG Protocol asks for both methods, and solar reads differently against each
Grid electricity sits in Scope 2 of the GHG Protocol. The Protocol asks you to report it two ways, and a credible report is clear about which basis a saving is stated under.
Location-based
Values your grid electricity at the average carbon intensity of the grid you sit on, using the published conversion factor.
- Uses the average grid intensity for your region
- Every kWh your array avoids importing reduces reported emissions at that grid factor
- The basis an ESOS or SECR submission expects
Market-based
Reflects the specific electricity products you have contracted, such as a green tariff backed by certificates.
- Tracks the contracts and instruments you actually hold
- Can already show a low or zero factor for purchased power
- Changes how an on-site array reads against it
Why the saving falls year on year
The honest caveat that cheap headline figures leave out is that the grid carbon factor is not fixed. As more of the grid is supplied by wind, solar and other low-carbon generation, the grams of CO2 per kWh of grid electricity fall, and the official conversion factors are revised downward over time to track that.
Because your carbon saving is generation multiplied by that factor, the same kWh displaces less carbon each year as the grid cleans up. Your array's output is broadly steady, declining only slowly with normal module degradation, but the carbon value of each unit it produces declines faster as the factor drops. A defensible projection reflects this with a falling factor across the years rather than holding today's figure flat and overstating the later savings. It is a real benefit, stated honestly rather than left to inflate itself.
How we present the figure honestly
We do not lead with a tonnage. The carbon saving we put in front of you is derived from the generation our model returns for your roof, using the geometry from our in-house drone survey and your own half-hourly consumption data, multiplied by the relevant published grid carbon factor. We state the method, the inputs and the framework basis alongside the result, so the number is one you can hand to an auditor or put in a board paper without it falling apart under a question.
Where the figure feeds formal reporting, such as ESOS or Streamlined Energy and Carbon Reporting (SECR), the methodology matters more than the headline, because the report has to be consistent and defensible year on year. We give you the calculation, the factor source and the Scope 2 basis, and we are clear that the per-kWh saving falls as the grid decarbonises. The figure comes from your modelled generation rather than a tonnage carried in from another site.
What does the grid carbon factor actually measure, and which version do you use?
The single most misused input in a carbon claim is the grid factor itself, because the UK government greenhouse-gas conversion factor set published each year by DESNZ contains more than one electricity figure and they answer different questions. The headline number most people reach for is the grid electricity generation factor, the average emissions per kWh consumed across the UK grid. Sitting alongside it are a transmission and distribution losses factor, which accounts for the energy lost moving electricity from the power station to your meter, and separate well-to-tank figures that cover the upstream emissions of producing the fuel before it is burned. A saving stated against generation alone is not wrong, but it is not the same as one stated against generation plus T and D losses, and a careful report says which it used.
On-site solar is relevant to the losses question precisely because it generates where it is consumed. Electricity your array produces and you use behind the meter never travels the transmission network, so it avoids the T and D losses that imported grid power carries. That is a genuine, defensible part of the saving, but it has to be claimed deliberately and against the right published sub-factor rather than folded in silently. We name the exact factor row, the publication year and whether the figure is generation-only or generation-plus-losses on any number we hand you, because that is what lets a reporting accountant trace it back to source. The same modelled generation that drives the carbon figure comes from your roof survey and load analysis, the same inputs described in our feasibility study guide.
How does annual averaging differ from real-time grid carbon intensity?
The DESNZ conversion factors give one number for the whole year, an annual average. That is the correct basis for a Scope 2 carbon report, and it is what an ESOS or SECR submission expects. It is not, however, how the grid actually behaves through a day. The carbon intensity of UK electricity swings widely between a windy night and a still evening peak, and the National Energy System Operator, formerly National Grid ESO, publishes a near real-time and forecast carbon intensity for Great Britain that exposes that variation directly.
This matters for solar because the two views can tell different stories about the same array. Solar generates in the middle of the day, and the marginal grid carbon it displaces at that moment is not identical to the flat annual average, since daytime hours carry their own intensity profile. For an annual carbon report the averaged DESNZ factor remains the right and auditable choice, and we use it. The real-time NESO data is a useful sense-check and a planning input, particularly if you are pairing the array with a battery and want to understand when stored export displaces the dirtiest grid power, but it is not a substitute for the dated annual factor in a formal disclosure. We keep the two separate and are explicit about which one any figure rests on, rather than borrowing the more flattering number from whichever view suits. Where a battery shifts the timing of what you self-consume and export, the load shaping behind that sits in your half-hourly metering data.
How do you handle the carbon of the panels themselves, the embodied emissions?
An honest carbon account does not stop at the generation saving, because the modules, inverters, mounting and cabling carry their own manufacturing emissions, the embodied carbon, before the array has produced a single kWh. A supplier who quotes only the avoided-grid figure is showing one side of the ledger. The standard way to weigh both sides is the energy payback time and the associated carbon payback: the period over which the clean generation offsets the energy and emissions that went into making and installing the system. The IEA Photovoltaic Power Systems Programme has published life-cycle assessment methodology and energy payback figures for PV for many years, and for UK-deployed crystalline-silicon systems the carbon payback is a matter of a few years against an asset life of 25 to 30, after which the array runs well into net-positive carbon territory.
We do not invent an embodied-carbon figure for your specific system, because a credible number comes from the manufacturer's own life-cycle data or an Environmental Product Declaration for the chosen module, verified to the EN 15804 standard that governs construction-product EPDs. Where a module range carries a published EPD we cite it; where it does not, we say so rather than fill the gap with a generic figure. The honest framing is that the embodied carbon is real, it is modest against the lifetime saving, and it is paid back early, but the net-positive claim is only as good as the source behind the embodied figure. This is the same discipline we apply when the carbon number feeds a wider sustainability narrative, covered in our social value and carbon reporting guide.
How do you avoid double counting carbon when you also sell the export?
The trap that catches many corporate carbon claims is double counting, and it bites hardest on the electricity your array exports rather than self-consumes. If you sell exported power, or if a green tariff and its certificates are involved, the right to claim the carbon benefit can sit with more than one party at once unless the boundary is drawn carefully. The GHG Protocol Scope 2 guidance exists largely to stop this, which is why it distinguishes the location-based and market-based methods and asks for instruments such as certificates to be tracked rather than assumed.
For on-site self-consumption the position is clean: you generate it, you use it, you avoid the import, and the saving is unambiguously yours. For exported kWh the question is who else might be claiming it, the offtaker, the certificate holder, or a customer buying a green product downstream, and a defensible report resolves that before it states a tonnage. We frame the saving so the self-consumed portion is claimed without qualification and the exported portion is treated according to the contractual and reporting boundary you actually have, rather than counted twice for a bigger headline. This is the same care that keeps the figure usable in a formal disclosure, the subject of our ESOS and SECR guide, and it is why we route the financial side of export, which is a separate question from the carbon side, to our finance guidance rather than blur the two.
Past the guide, this is how your figure actually gets set.
-
Survey On-site 3D drone survey
Our own insured pilot flies your roof and captures the real geometry and shading, so the design starts from your building instead of a satellite guess.
Booked to suit your operating hours
-
Model PV*SOL design and proposal
We model the array in bankable-grade software, size it around your daytime load, and set out generation, savings and payback across three funding routes.
Modelled, not promised
-
Install Engineered and installed
Designed and installed to BS 7671, commissioned to IEC 62446-1, connected under G99 and run under CDM 2015. Alectrona is typically the Principal Contractor.
Outside MCS, assured by the non-MCS stack
-
Aftercare Operations and maintenance
A 12-month defects period backed by an Insurance-Backed Guarantee, then ongoing operations and maintenance so the asset keeps earning for its full working life.
Kept performing, year on year
Last updated June 2026
Carbon savings methodology: common questions
Because an honest tonnage is the output of a calculation rather than a number to be guessed. The saving is your array's modelled generation in kWh multiplied by the grid carbon factor for the electricity it displaces, and both inputs are specific to your site and the year. We give you the figure with its working, the modelled generation, the published factor and the Scope 2 basis, so it stands up in a report rather than a round number with nothing behind it.
The grid carbon intensity from the official UK government greenhouse-gas conversion factors, published by the department now known as DESNZ and updated each year. That figure, in grams of CO2 equivalent per kWh, is the carbon you avoid for each unit of grid electricity your array lets you stop importing. Using a published, dated factor is what makes the saving auditable rather than a sales assumption.
They are the two ways the GHG Protocol asks you to report Scope 2 emissions from bought electricity. The location-based method values your grid power at the average intensity of the grid you sit on, using the published factor. The market-based method reflects the specific electricity products you have contracted, such as a certificated green tariff. Solar reads differently against each, so a credible report states which basis a saving is given under rather than blurring the two.
Because the grid is getting cleaner. As more low-carbon generation comes online, the carbon factor per kWh of grid electricity falls, and the official factors are revised down to match. Your saving is generation times that factor, so the same kWh displaces less carbon each year. Your output stays broadly steady, but the carbon value of each unit declines. A defensible projection shows that decline rather than holding today's factor flat and overstating the later savings.
The calculation is built to feed that kind of reporting, and the methodology is what matters there: a consistent, dated factor source and a clear Scope 2 basis, applied the same way each year. We give you the inputs and the method behind the figure rather than a bare tonnage. Your own reporting accountant or assessor confirms how it lands in your specific ESOS or SECR submission, since the boundaries and obligations vary by organisation.
There is no separate charge for the carbon figure, because it falls out of work we are already doing. The modelled generation that drives the calculation comes from your roof survey and half-hourly load analysis, and the grid factor is a published DESNZ figure, so the carbon saving is presented alongside the feasibility outputs at no extra line item. The wider system cost is survey-led and specific to your roof and load rather than a per-kWp rate, which is why we set it out in our commercial solar cost guide instead of quoting a figure here.
The carbon figure is ready as soon as the underlying generation model is, since it is that modelled kWh multiplied by the published grid factor. In practice that means it arrives with your feasibility outputs, once the drone survey and half-hourly consumption analysis are complete and run through the yield model. We do not hold it back or treat it as a separate exercise, and if you need the figure restated under a particular reporting basis, location-based or market-based Scope 2, that is a presentation step rather than a fresh round of work.
Get the numbers for your roof.
A guide can only take you so far. The figure you get is modelled from your own half-hourly load and a system sized from the on-site drone survey. No obligation, and systems this size sit outside the domestic MCS scheme, so the assurance is the engineering stack.
- On-site 3D drone survey, fully insured in-house pilot
- Half-hourly load modelled in PV*SOL before anything is specified
- Engineer-led, assured to the non-MCS standard (CDM 2015)
- Capex, lease-purchase or PPA, whichever suits you