Skip to content

Alectrona

Commercial guide

Is your commercial solar array actually underperforming?

A bad-looking month is not proof of a fault. Underperformance is a sustained shortfall against your site's own weather-normalised model, and the two metrics that show it are specific yield and performance ratio.

  • Commercial scale, over 50 kWp
  • On-site 3D drone survey + PV*SOL
  • Engineer-led, outside MCS
Reviews

The feedback we work to earn

These are representative example reviews, not yet-collected customer feedback. They are written to illustrate the kind of feedback Alectrona aims to earn and are shown as design placeholders while we gather and verify reviews from our first commercial clients. Alectrona is the commercial solar trading brand of RVTC LTD.

What set Alectrona apart was the documented design pack. We had quotes from three installers, but only Alectrona handed us a full set of drawings, a single-line diagram and a design referencing BS 7671 and the G99 connection process. The whole thing read like an engineering submission rather than a sales brochure. Our M&E consultant reviewed it and signed it off without a single query. That gave the board the confidence to release the capital.

Estates Manager, academy trust (Yorkshire)

Other firms priced our roof off a satellite image and a desktop guess. Alectrona flew an in-house drone survey, fully insured and flown by a qualified commercial drone pilot, and built a 3D model of the actual roof. It picked up plant, vents and a parapet line that a flat aerial photo had completely missed, which changed the panel layout. I would rather find that out at design stage than on the day the scaffold goes up. The accuracy of that survey is the reason I trusted everything that followed.

Facilities Manager, distribution centre (East Midlands)

As a finance director I was wary of being oversold a system bigger than we could use. Alectrona modelled the array against our actual half-hourly consumption data rather than an annual total, so it is sized to what we genuinely draw on site during the day. They were honest that exporting surplus is worth far less than self-consumption, and built the design around that. The capital case stacked up because the engineering was honest, not because the numbers were inflated.

Finance Director, logistics group (North West)

We were undecided between buying outright, leasing and a PPA. Alectrona laid out all three side by side with the pros and cons of each against our balance sheet, instead of pushing the one that pays them best. They were clear about where a PPA makes sense and where capex wins, and pointed us at our own accountant for the tax treatment. The survey and design took a little longer than I expected, but the thoroughness was worth the wait. Genuinely consultative.

Property Director, retail park (West Midlands)

The install crew were tidy and well run, and worked to a clear CDM 2015 plan with a proper site induction and RAMS. What impressed me most was the handover. We received a full commissioning pack with the IEC 62446-1 test results, certification, O&M documentation and an as-built record for our maintenance team. As the people who have to live with this asset for the next twenty years, having that paperwork in order matters enormously. Nothing was left loose.

Operations Director, food manufacturer (Lincolnshire)

I expected the usual hard sell and got the opposite. After surveying our site Alectrona told us one roof section was not worth covering because of shading, and that a smaller, well-sited array was the better investment than filling every square metre. There was no commission-driven upselling and no pressure. For a six-figure capital project, that straight talk is exactly what you want from the people advising you. We will be using them again on our second site.

Managing Director, engineering firm (Sheffield)

  • How you judge it Sustained shortfall against your own weather-normalised model, not a single low month
  • Specific yield Actual energy per installed kWp, compared to your PV*SOL or PVsyst figure
  • Performance ratio Weather-normalised quality metric per IEC 61724-1; ~0.75 to 0.85 is normal (rule of thumb)
  • Common causes String or inverter faults, soiling, new shading, export clipping, monitoring gaps
  • How it is diagnosed A baseline audit against the model, then string-level interrogation and root-cause analysis
01 The short version

Is your solar underperforming?

The honest first answer is that you cannot judge a solar array on a single low month, because the weather varies more than any fault does. Underperformance means the system is sustaining less output than it should after the weather is accounted for, measured against your own modelled figure rather than a number from another site. Two metrics carry that judgement: specific yield, the actual energy produced per unit of installed capacity, and performance ratio, the weather-normalised quality metric that flags losses the weather alone does not explain.

This guide sets out what those two metrics are, what a healthy figure looks like as a rule of thumb, the common causes of a real shortfall on a commercial array, and how a performance audit pins down the cause. A system above 50 kWp sits outside the domestic MCS scheme, so the assurance here is the engineering one: the original yield model, the monitoring data and a structured root-cause analysis, not a certification badge.

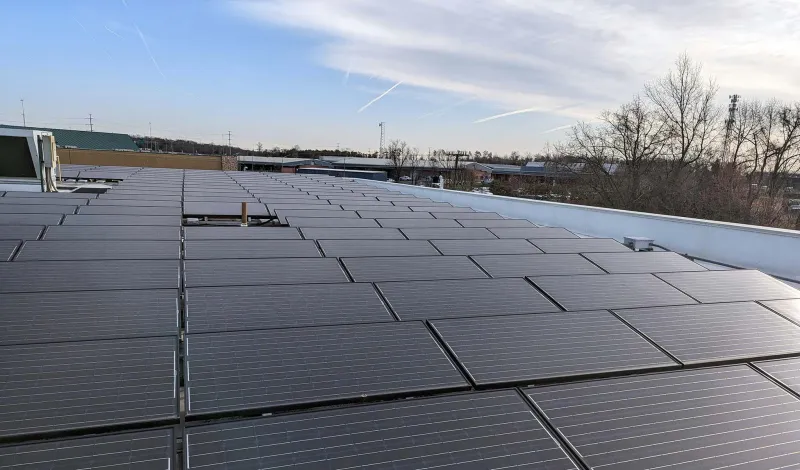
Commercial rooftop solar, the subject of this guide: Is your solar underperforming?
An on-site drone survey and a PV*SOL model behind every quote.
02 The two metrics that tell you

Specific yield and performance ratio

Specific yield is the actual AC energy a system produces per unit of installed DC capacity over a period, expressed in kWh per kWp. It lets you compare your site against its own modelled figure, season by season. As broad orientation, UK rooftop arrays commonly land somewhere in the region of several hundred to around a thousand kWh per kWp a year depending on location, pitch and orientation, with a well-oriented south-facing array sitting toward the higher end. Those national figures are only a sanity check. The right comparison is always your own modelled figure from PV*SOL or PVsyst, because that model was built for your exact roof.

Performance ratio (PR) is the weather-normalised metric, defined formally in the IEC 61724-1 standard. It expresses actual AC output as a proportion of the theoretical output for the irradiance the site actually received, so it strips the weather out of the comparison. A PR of 0.80 means a fifth of the available solar energy was lost along the way, to temperature, soiling, shading, inverter clipping, wiring resistance and any downtime. The PR is the standard way to flag underperformance that the weather alone cannot explain.

03

What a healthy figure looks like (as a rule of thumb)

The band labels below are widely repeated industry conventions, not a regulatory pass or fail. IEC 61724-1 defines how PR is calculated, not what value counts as good, so treat these as rules of thumb rather than a standard's verdict:

  • A PR around 0.75 to 0.85 is normal for a typical commercial array.
  • Above 0.85 reads as high-performing; a modern, well-kept park should generally exceed 0.80.
  • Below about 0.70 points to significant losses and warrants investigation.

The same caution applies to specific yield. A figure that looks low against a national average may be entirely correct for a north-east-facing roof in a cloudier region, and a figure that looks healthy can still be hiding a faulty string. This is why the test that matters is your site against its own model, weather-normalised, sustained over time. A single deviation is noise; a persistent gap against the model is the signal.

04

The common causes of a real shortfall

When a commercial array genuinely underperforms its model, the cause is usually one of a familiar set, and several can run at once:

  • String or MPPT faults. A single string or tracker dropping out can quietly remove a slice of output while the rest of the system reads normally.
  • Soiling. Dust, pollen, bird fouling and traffic or industrial grime cut the light reaching the cells. UK losses are usually lower than in dusty climates because rain helps, and rain clears most loose dust but not sticky contaminants, so persistent soiling can remain. The amount is highly site-dependent (agricultural, coastal, roadside or low-pitch roofs see more), so it is treated as a site-specific figure, often several percent, rather than a fixed number.
  • New or unmodelled shading. A new building, a stack, signage or grown-out vegetation that was not in the original model.
  • Inverter faults or downtime. An inverter fault, or simply time offline, removes output directly.
  • Export-limit clipping. Where an EREC G100 export-limitation scheme throttles the inverter to stay within an agreed cap, the excess solar is lost by design. This is covered in its own section below, because it is a deliberate constraint rather than a fault.
  • Module degradation. Real and expected, also covered below, and only a fault when it runs ahead of the warranted curve.
  • Monitoring gaps. The cause that hides all the others. If the monitoring cannot see a single string, a string-level fault can run for weeks before anything moves the plant figure.
05

Degradation, export limits and the monitoring that finds the rest

Some apparent underperformance is not a fault at all, and reading it correctly matters before anyone pays for a site visit.

Degradation is expected, not failure. NREL analysis puts the median degradation of crystalline-silicon modules at around 0.5% a year, with premium n-type cells (TOPCon, HJT) typically lower, so roughly 85 to 90% of the original rated output is commonly retained at 25 years. Linear performance warranties usually guarantee no more than around half a percent a year after the first year. It only counts as underperformance when the measured loss runs ahead of that warranted, modelled curve.

Export limitation can clip output by design. When a G100 scheme reduces the inverter's output to hold the site within its agreed export cap, the surplus solar is simply not produced. That is a legitimate gap against the unconstrained model, distinct from any fault, and the standard mitigation is battery storage to capture the throttled energy rather than waste it.

The monitoring granularity decides what you can catch. Inverter or plant-level monitoring aggregates everything and can miss a single-string problem for weeks. String-level monitoring measures DC current and voltage per string, so it catches the high-impact fault modes first, often before they move the plant PR. The standard detection technique is peer-group comparison: each string is checked against its identical siblings, and the odd one out is flagged. A practical performance audit compares measured generation against the original PV*SOL or PVsyst model, interrogates the monitoring platform for anomalies (serious operations work treats a daily yield deviation beyond a few percent, or a phase imbalance beyond a couple of percent, as worth investigating), then commissions a root-cause analysis. Where we take over an existing system, that baseline audit against the model is where the work starts.

06

Can a drone thermal survey find the fault the monitoring cannot localise?

Monitoring tells you a string is down; it rarely tells you which module, junction box or connector is the cause. That is the job of aerial infrared thermography, and on a commercial roof it is the single most efficient way to convert a plant-level shortfall into a named repair list. An inspection-grade thermal camera flown over the array reads the surface temperature of every module, and a healthy cell runs cool because it is exporting its energy as current. A cell that has gone open-circuit, a bypass diode that has failed, a hot solder joint or a corroded connector all show up as a temperature anomaly, because the energy that should have left as electricity is dissipating as heat instead.

The recognised thermal-imaging procedure for grid-connected PV is set out in IEC TS 62446-3, which defines how the survey is flown, the irradiance and wind conditions it needs to be valid, and the failure signatures the analyst is reading. A single hot cell, a hot module, a hot string and a hot bypass-diode segment each have a distinct thermal fingerprint, so the report identifies what is wrong and where, beyond simply flagging that something is. We fly this in-house under our own A2 CofC and GVC drone authorisation, so the thermal pass is part of a structured performance audit rather than a separate sub-contract, and it pairs directly with the string-level monitoring data so the camera is pointed at the row the data already flagged. The two techniques together answer a question neither answers alone: the monitoring says how much output is missing, the thermal scan says which physical component is taking it.

07

How do you tell soiling apart from a genuine fault before paying for a clean?

Soiling and a real fault can both show as a slow slide in output, and the costly mistake is to clean a roof that has an electrical problem, or to chase a fault that a wash would have cured. The two are separable by their signature. Soiling is broadly uniform across an array and it is gradual and recoverable: output drifts down over weeks, then steps back up after meaningful rain, because rain clears most loose dust even though it leaves sticky contaminants behind. A fault is the opposite shape. It is localised to a string or a module rather than spread across the whole field, it does not recover after rain, and on a thermal scan it shows a hot signature that a clean panel never does.

That distinction decides the remedy and the spend. Where the loss is uniform, recoverable and rain-correlated, the answer is a survey-led cleaning schedule rather than an electrical investigation, and our guide on commercial solar panel cleaning covers how that schedule is set from the site's own soiling rate. The soiling rate itself is site-specific: agricultural dust, coastal salt, roadside grime and low-pitch roofs that drain poorly all soil faster, so the cleaning interval is read from your monitoring data rather than set to a calendar default. Where the loss is localised, persistent and thermally hot, no amount of cleaning will fix it and the work moves to fault diagnosis. The performance audit makes that call deliberately, because washing a roof that needs a connector replaced wastes money and leaves the real loss running.

08

What does a performance audit actually deliver, and what happens after it?

An audit is only useful if it ends in a decision and a costed action rather than a chart pack. A structured commercial performance audit works through a fixed sequence. It rebuilds or recovers the original yield model in PV*SOL or PVsyst so there is a defensible expected figure to measure against, interrogates the monitoring platform for the anomalies the plant total hides, runs the aerial thermal scan to localise anything the data flags, and where needed adds on-roof electrical testing of the suspect strings to IEC 62446-1, the commissioning and inspection standard for grid-connected PV. The output is a quantified loss breakdown: how much output is missing, what each cause is contributing, and which losses are recoverable against which are inherent.

What happens next depends on what the audit finds, and the honest split matters. Some shortfalls are not faults at all and the audit closes them out: expected degradation inside the warranted curve, or export-limit clipping that is working as designed. Others resolve into a discrete repair, a failed inverter replacement, a string reconnection, a module swap or a cleaning schedule, each with a clear cost against the kWh it recovers. Where the audit covers a system we did not install, it becomes the baseline for a system takeover or, for an array that has been left without proper support, our orphaned-system rescue. The principle throughout is that we only recommend a remedy where the recovered generation justifies the work, and where the cause turns out to be expected behaviour we say so rather than sell a fix the array does not need.

09

Why is the inverter the first thing checked when output drops?

The inverter is the busiest component in the system and statistically the most likely single point of failure over a system's life, so when output falls without an obvious external cause it is the first place a competent audit looks. Its symptoms are distinctive. A tripped or faulted inverter removes its whole share of the array's output at once, which shows as a clean step down rather than a gradual slide. A failed MPPT channel on a multi-tracker inverter quietly removes the strings on that channel while the rest of the unit reads normally, which is exactly the kind of partial loss the plant total can mask for weeks. A derating fault, where the inverter throttles itself because it is running too hot or has detected a grid-voltage excursion, shows as output that is capped below the model on the brightest days specifically.

That last symptom is where reading the data carefully earns its place, because a capped output curve has two completely different causes that look similar on a chart. One is a fault, an inverter derating because of heat or a grid condition. The other is deliberate, the export-limit clipping imposed by an EREC G100 export-limitation scheme holding the site inside its agreed cap, which is working as intended and is no fault at all. The inverter's own event log usually separates the two, recording the derating reason and the grid parameters the connection is engineered to under EREC G99. Distinguishing a genuine derating fault from designed clipping is a routine part of the audit, and getting it right is the difference between replacing a healthy inverter and correctly identifying that the array was simply throttled to its export agreement.

10 How we quote

Past the guide, this is how your figure actually gets set.

  1. Survey

    On-site 3D drone survey

    Our own insured pilot flies your roof and captures the real geometry and shading, so the design starts from your building instead of a satellite guess.

    Booked to suit your operating hours

  2. Model

    PV*SOL design and proposal

    We model the array in bankable-grade software, size it around your daytime load, and set out generation, savings and payback across three funding routes.

    Modelled, not promised

  3. Install

    Engineered and installed

    Designed and installed to BS 7671, commissioned to IEC 62446-1, connected under G99 and run under CDM 2015. Alectrona is typically the Principal Contractor.

    Outside MCS, assured by the non-MCS stack

  4. Aftercare

    Operations and maintenance

    A 12-month defects period backed by an Insurance-Backed Guarantee, then ongoing operations and maintenance so the asset keeps earning for its full working life.

    Kept performing, year on year

11 FAQ

Is your solar underperforming?: common questions

Compare it against its own model, not a national average or a single month. Two metrics carry the judgement: specific yield, the energy per installed kWp, set against your PV*SOL or PVsyst figure, and performance ratio, which normalises out the weather. A low month proves nothing on its own, because the weather varies more than any fault. A sustained gap against the weather-normalised model is the real signal, and that is what a performance audit measures.

As a rule of thumb, a PR around 0.75 to 0.85 is normal for a commercial system, above 0.85 reads as high-performing, and below roughly 0.70 warrants investigation. These are industry conventions, not a regulatory pass or fail: IEC 61724-1 defines how PR is calculated, not what value is good. A PR of 0.80 means about a fifth of the available solar energy was lost to temperature, soiling, shading, clipping, wiring and downtime combined.

Often it is neither a fault nor a problem. Modules degrade by design; NREL analysis puts the median at around half a percent a year for crystalline silicon, with premium n-type cells typically lower, so roughly 85 to 90% of rated output is commonly retained at 25 years. Linear warranties usually guarantee no more than around that rate after year one. It only counts as underperformance when the measured loss runs ahead of the warranted, modelled curve, which an audit can confirm.

Yes, and it is a common and legitimate cause that is not a fault. Where an EREC G100 export-limitation scheme throttles the inverter to stay within an agreed export cap, the surplus solar is simply not produced. That shows as a gap against the unconstrained model. The standard mitigation is battery storage, which captures the energy that would otherwise be clipped rather than wasting it. An audit separates clipping from a genuine fault.

Because inverter or plant-level monitoring aggregates everything, a single faulty string can be lost in the total for weeks. String-level monitoring measures DC current and voltage on each string, so the highest-impact fault modes are caught first, often before they move the plant performance ratio. The standard technique is peer-group comparison: each string is checked against its identical siblings, and the outlier is flagged. A monitoring gap is itself a cause of unnoticed underperformance.

There is no single price, because the work scales with the array. A small single-inverter rooftop and a multi-megawatt ground mount need very different amounts of survey, thermal-scan and on-roof testing time, so a figure can only follow a look at your site, your monitoring access and the original design data. We scope the audit against those specifics rather than publish a rate. Where the loss it recovers is set against the cost of finding it, the wider economics of a commercial system are covered in our guide to commercial solar cost.

A first read is fast, because much of it is desk-based: pulling your monitoring history and comparing it against the model can flag whether there is a real, sustained shortfall within days of getting platform access. Localising the cause takes longer, since the aerial thermal scan needs a clear, bright, low-wind day to be valid under IEC TS 62446-3, and any on-roof electrical testing has to be scheduled around site access and safe working. A typical diagnosis runs over a small number of weeks from access to costed findings, driven by weather windows and roof access rather than the analysis itself.

Get a commercial quote

Get the numbers for your roof.

A guide can only take you so far. The figure you get is modelled from your own half-hourly load and a system sized from the on-site drone survey. No obligation, and systems this size sit outside the domestic MCS scheme, so the assurance is the engineering stack.

  • On-site 3D drone survey, fully insured in-house pilot
  • Half-hourly load modelled in PV*SOL before anything is specified
  • Engineer-led, assured to the non-MCS standard (CDM 2015)
  • Capex, lease-purchase or PPA, whichever suits you