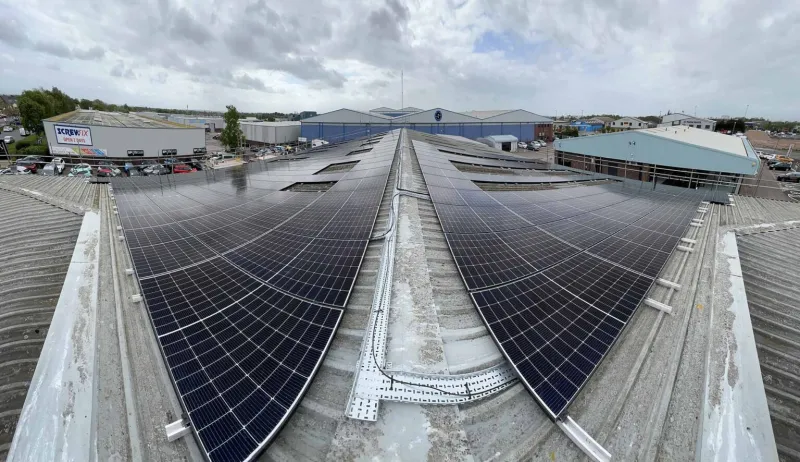
What set Alectrona apart was the documented design pack. We had quotes from three installers, but only Alectrona handed us a full set of drawings, a single-line diagram and a design referencing BS 7671 and the G99 connection process. The whole thing read like an engineering submission rather than a sales brochure. Our M&E consultant reviewed it and signed it off without a single query. That gave the board the confidence to release the capital.
Alectrona
Commercial solar by sectorCommercial solar for water & utilities.
A treatment works pumps, aerates and treats around the clock because it has to keep the flow moving. Almost every unit the array generates is consumed on site the moment it lands rather than exported, which gives water and utilities one of the steadiest self-consumption profiles of any sector.
- Water and wastewater sites carry a heavy, constant process load that self-consumes almost everything generated, and many hold large roof or land area.
- Sized from your half-hourly load
- Over 50 kWp, outside MCS
The feedback we work to earn
These are representative example reviews, not yet-collected customer feedback. They are written to illustrate the kind of feedback Alectrona aims to earn and are shown as design placeholders while we gather and verify reviews from our first commercial clients. Alectrona is the commercial solar trading brand of RVTC LTD.
Other firms priced our roof off a satellite image and a desktop guess. Alectrona flew an in-house drone survey, fully insured and flown by a qualified commercial drone pilot, and built a 3D model of the actual roof. It picked up plant, vents and a parapet line that a flat aerial photo had completely missed, which changed the panel layout. I would rather find that out at design stage than on the day the scaffold goes up. The accuracy of that survey is the reason I trusted everything that followed.
As a finance director I was wary of being oversold a system bigger than we could use. Alectrona modelled the array against our actual half-hourly consumption data rather than an annual total, so it is sized to what we genuinely draw on site during the day. They were honest that exporting surplus is worth far less than self-consumption, and built the design around that. The capital case stacked up because the engineering was honest, not because the numbers were inflated.
We were undecided between buying outright, leasing and a PPA. Alectrona laid out all three side by side with the pros and cons of each against our balance sheet, instead of pushing the one that pays them best. They were clear about where a PPA makes sense and where capex wins, and pointed us at our own accountant for the tax treatment. The survey and design took a little longer than I expected, but the thoroughness was worth the wait. Genuinely consultative.
The install crew were tidy and well run, and worked to a clear CDM 2015 plan with a proper site induction and RAMS. What impressed me most was the handover. We received a full commissioning pack with the IEC 62446-1 test results, certification, O&M documentation and an as-built record for our maintenance team. As the people who have to live with this asset for the next twenty years, having that paperwork in order matters enormously. Nothing was left loose.
I expected the usual hard sell and got the opposite. After surveying our site Alectrona told us one roof section was not worth covering because of shading, and that a smaller, well-sited array was the better investment than filling every square metre. There was no commission-driven upselling and no pressure. For a six-figure capital project, that straight talk is exactly what you want from the people advising you. We will be using them again on our second site.
- Indicative size indicative 250 kWp – 1 MWp+ (treatment works, pumping stations, large land area)
This page is for the operators and asset teams behind water and wastewater infrastructure: treatment works, sewage and effluent plants, raw and clean-water pumping stations, boosters, service reservoirs and the wider process estate that keeps supply and discharge moving. These are not buildings in the conventional sense. They are process sites, often spread across a large land holding, with scattered structures, exposed plant and a load that is set by hydraulics and discharge consents rather than by opening hours.
That makes water and utilities worth modelling carefully, because the demand here is driven by obligation. Pumps move flow against fixed heads, aeration blowers hold dissolved oxygen at consented levels, and treatment trains run continuously to keep effluent within permit. The electricity bill follows that duty, and it is one of the largest controllable operating costs across a regulated water business. On-site generation offsets it directly, at the point of use, which is exactly where a commercial array earns most.
Engineer-led commercial solar, over 50 kWp and outside MCS.
What makes solar work for water & utilities.
Solar pays best when the electricity is used on site rather than exported, because a unit consumed offsets an expensive import unit while a unit sent to the grid is paid far less. The return therefore tracks how well generation lines up with demand, not how many panels you can fit. Water and utilities reads about as well as any sector on that test, and for a reason that is distinct from the other continuous loads we model. A data centre runs flat because the IT load never stops, and a cold store runs flat because refrigeration never stops. A treatment works runs flat because the flow never stops: it is a regulated, round-the-clock process obligation, not a shift pattern or a cooling duty. Pumping, aeration and treatment draw a heavy baseload through the day and through the night, so whatever the array produces in daylight is swallowed straight into the process. Very little is left to export.
The honest qualifiers are about profile, not fit. Some loads here move with the weather: storm flows lift pumping and treatment demand, and aeration can climb in warm conditions when the array is also generating strongly, so on parts of the estate the heaviest demand and the strongest output line up across the year. Other assets, a remote booster station or a small pumping site, carry a lighter or more intermittent draw, where the export position and the network connection matter more. Because a utility runs a portfolio of these sites rather than one building, the strongest approach is usually to model them as a fleet, putting generation where the continuous process load sits and reading each site on its own half-hourly data before anything is sized.
What a typical system looks like.
Water and utility sites rarely give you a single clean roof. The usable area is spread across process buildings, motor control rooms, inlet and outlet structures, storage and ancillary blocks, and crucially across land and water that no other sector carries in the same way. A treatment works typically holds open ground alongside the process train, and many sites sit beside a reservoir or a covered service reservoir. That opens routes a rooftop sector does not have: ground-mounted arrays on spare land, and floating solar on a suitable reservoir surface, both of which can be co-located with the demand they feed. As an indicative orientation only, sites in this sector run from around 250 kWp to 1 MWp and above, with the land and reservoir area on larger works able to push a scheme well past that. Treat that band purely as a sense of scale. It is not a quote and carries no price. The real figure comes from the on-site survey and the half-hourly load model, sized to the process demand the site actually carries rather than to any roof, field or water surface in isolation.
Statutory duty sets the load, around the clock
A treatment works draws power because the law requires the flow to keep moving. Sewage and effluent plants run their treatment trains continuously to hold the discharge within the consent set by the environmental regulator, and a breach of that permit triggers regulatory enforcement. Clean-water sites carry the parallel obligation: pumping, dosing and disinfection run to keep supply within the drinking-water quality standards the Drinking Water Inspectorate enforces. Neither duty pauses overnight, at weekends or over a bank holiday, which is why the baseload underneath a water or wastewater site is structurally flatter than almost any other commercial occupier we model.
That duty makes the electricity bill a fixed and rising line on a regulated cost base. Pumping against fixed hydraulic heads, holding dissolved oxygen at consented levels with aeration blowers, and running the treatment process to permit are non-discretionary loads, so the demand cannot be shed to chase a cheaper tariff the way a discretionary load can. On-site generation is one of the few levers that reduces that import directly, at the meter, without touching the process. Because the obligation runs around the clock while the array generates only in daylight, the honest framing is that solar trims the daytime portion of a continuous duty rather than covering the night load, and the size of that daytime share is exactly what the half-hourly model resolves before anything is specified.
The regulatory backdrop also shapes how the work has to be delivered. These are live process assets where an interruption to pumping, aeration or treatment can put a discharge consent or a supply standard at risk, so the install is sequenced under CDM 2015 with a Principal Designer and Principal Contractor appointed and the process protected throughout, and the connection is taken through a G99 agreement with the network operator before any plant is energised. Across the Yorkshire, North and North-East Lincolnshire footprint that operator is Northern Powergrid, and its connection timeline frequently governs the programme start more than the panels do.
Funding an array against the AMP cycle and a regulated balance sheet
Water companies invest on a fixed regulatory rhythm, and a solar scheme lands best when it is built to that rhythm. Capital is planned and committed across the AMP investment cycle alongside the regulated outputs the business is held to, so the strongest approach is to scope generation as a planned capital line within that programme rather than a one-off purchase squeezed in between price reviews. Because a utility runs a portfolio of process sites rather than a single building, we can survey and model individual assets or a fleet together, which lets the generation be phased across the programme, leading with the works and pumping stations whose continuous load self-consumes the highest share first.
How the array is funded then depends on where it has to sit on the balance sheet. Where the business funds the capital directly, the half-hourly model and the drone survey give the building-level evidence a regulated capital case needs, and the capital-allowances position is worth setting out for the entity that carries the tax charge. Where a site is held by a trading or arm's-length body, or where the business would rather not carry the capital, a power purchase agreement is an option, with a third party owning the array and the site buying the generation it consumes. We are not a funder and we do not advise on the finance, but the modelling is the foundation any of those routes is built on; our finance pages set out the options for a system of this size.
Any return case stays grounded in your own data. We do not attach a payback or a saving figure to a sector page, because the number that matters comes from your site's half-hourly load and the PV*SOL generation model, not from a category. The modelled self-consumption split, read site by site across the fleet, is what a regulated business case and any funding route both rest on, and we give it to you honestly before anything is specified.
Commercial solar for water & utilities: common questions
Because the process never stops. Pumping, aeration and treatment run around the clock to keep flow moving and to hold effluent within discharge consents, so the site carries a heavy baseload day and night. Whatever the array produces in daylight is drawn straight into that continuous process load and used on site rather than exported, and power used on site is worth far more than power exported. The exact split still comes from your half-hourly data, since profiles differ between a large works and a remote booster, but self-consumption here is among the highest of any sector we model.
Often, yes, and it is one of the things that sets this sector apart. Process sites rarely offer a single large roof, but they frequently hold open ground beside the treatment train and a reservoir or covered service reservoir nearby. That opens ground-mounted arrays on spare land and floating solar on a suitable water surface, both co-located with the demand they feed. The drone survey assesses the roofs, the ground and any water area together, and the PV*SOL model decides where the array does the most useful work against your actual load.
As an indicative band for orientation only, sites in this sector run from roughly 250 kWp to 1 MWp and above, with larger works able to go well beyond that once spare land or a reservoir surface is brought in. That is a sense of scale rather than a quote, and it carries no price. Your real system size comes from the on-site drone survey and the PV*SOL model, sized to the continuous pumping, aeration and treatment load the site actually carries rather than to the area available.
It is designed to land as a commercial capital project on your timeline rather than a one-off. We can survey and model individual assets or a portfolio of sites, so the generation can be planned and procured alongside an AMP programme and the operational net-zero commitments behind it. Each site is read on its own half-hourly load, and because systems over 50 kWp sit outside MCS, the work is assured by the non-MCS engineering stack and delivered under CDM 2015 with the appropriate duty-holders appointed, on a live process asset where continuity of supply is protected throughout.
We do not quote a price from a category, because the cost of a process-site array turns on where the panels go and how much of the generation the site uses. A scheme spread across process roofs, spare land and a reservoir surface costs differently from a single roof, and the value sits in the import it offsets rather than the kit alone. Cost per kWp falls as the system grows, and our commercial solar cost guide sets out the honest bands. The first feasibility read is free; the real figure for your site comes from the drone survey and the half-hourly model, with the payback case built on your own data in the payback by sector guide.
From first survey to energised system, most commercial schemes run over several months, and on a live water asset the connection and the works programme set the pace more than the panels do. A G99 connection is applied for early with the local network operator, Northern Powergrid across the Yorkshire and Lincolnshire footprint, since its timeline can govern the start, and the install is sequenced under CDM 2015 around continuous pumping, aeration and treatment so process safety and supply are never interrupted. We give you a dated programme after the survey; our installation timeline guide explains the stages.
See what your roof and your load would actually do.
We model your half-hourly consumption against a system sized from an on-site drone survey, so the figure you get is yours, not a from-price. No obligation, no MCS gatekeeping on systems this size.
- On-site 3D drone survey, fully insured in-house pilot
- Half-hourly load modelled in PV*SOL before anything is specified
- Engineer-led, assured to the non-MCS standard (CDM 2015)